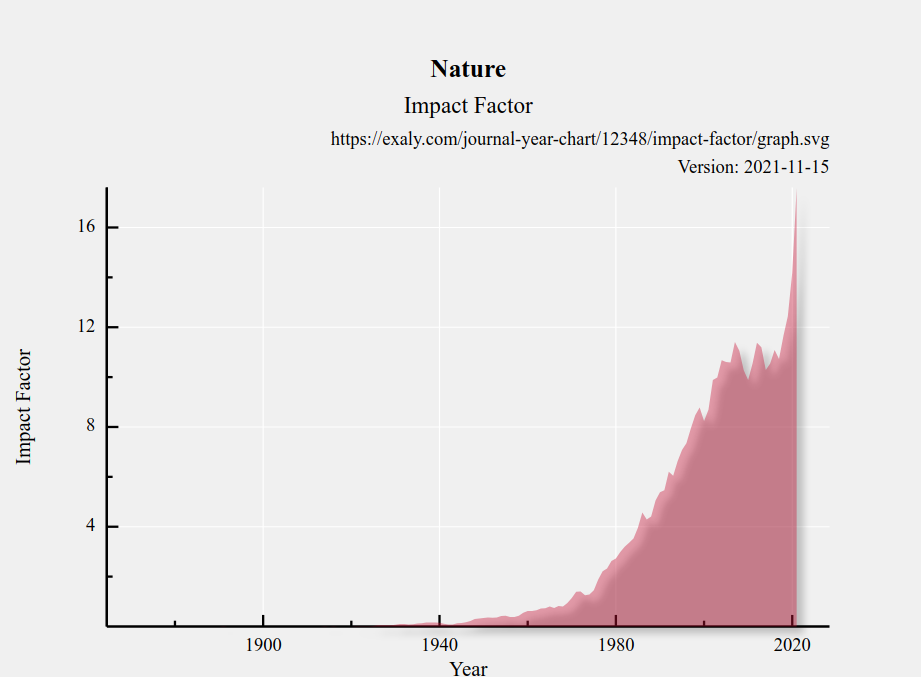
First note that you get different values for the impact factor depending on what set of papers and citations you use as an input. That Wikipedia article describes the methodology for the "official" impact factor from Clarivate:
The value of impact factor depends on how to define "citations" and "publications"; the latter are often referred to as "citable items". In current practice, both "citations" and "publications" are defined exclusively by ISI as follows. "Publications" are items that are classed as "article", "review" or "proceedings paper"[9] in the Web of Science (WoS) database; other items like editorials, corrections, notes, retractions and discussions are excluded. WoS is accessible to all registered users, who can independently verify the number of citable items for a given journal. In contrast, the number of citations is extracted not from the WoS database, but from a dedicated JCR database, which is not accessible to general readers. Hence, the commonly used "JCR Impact Factor" is a proprietary value, which is defined and calculated by ISI and can not be verified by external users.
SJR does something different, using the Scopus database instead of Web of Science. Scopus is known for being more inclusive than WoS. See this answer for a more detailed description of some of the differences. Thus, their data yielding different values should not be surprising.
In addition, SJR's definitions of some things stand in contrast to those of JCR. First, they describe (click on the little table icons to see the descriptions) their "citations per document" statistic as
This indicator counts the number of citations received by documents from a journal and divides them by the total number of documents published in that journal.
i.e. it seems they use total documents, the sum of citable and noncitable documents, in the denominator. This is different from the usual impact factor, which would exclude many of these documents.
Finally, you mentioned that the number of citable documents for a given year is apparently higher than the total number of documents. This actually isn't inconsistent using SJR's definitions, just confusing. They describe citable and noncitable documents as
Not every article in a journal is considered primary research and therefore "citable", this chart shows the ratio of a journal's articles including substantial research (research articles, conference papers and reviews) in three year windows vs. those documents other than research articles, reviews and conference papers.
What this seems to mean in practice is that the sum of citable and noncitable documents in a given three-year window labeled by a year equals the sum of total documents over the three years prior. Using 2017 as an example, the numbers from SJR are
2014: total documents = 2,373
2015: total documents = 2,512
2016: total documents = 3,108
2017: citable documents = 4,400
2017: noncitable documents = 3,549
This yields a total number of documents in the three-year window labeled 2017 equal to 7,993 = 4,400 + 3,549 = 2,373 + 2,512 + 3,108.
In conclusion, if you need the "official" impact factor of a journal, use the "official" numbers. If you don't need it, then just be aware that there may be significant methodological differences between different indices.

