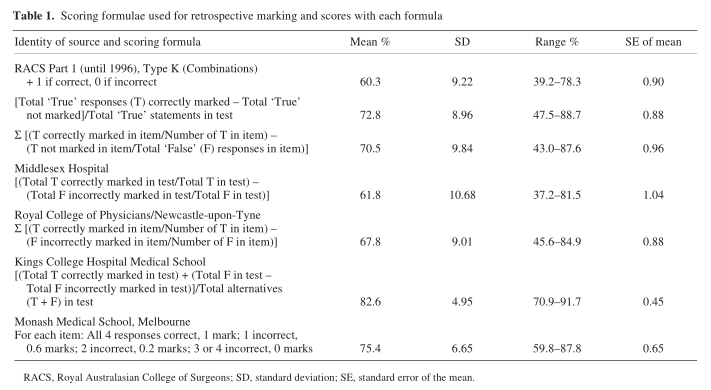
You are, essentially, evaluating a binary predictor.
The usual score is known as accuracy (i.e., probability of giving the correct answer). For a random (coin toss) predictor you will get 50% (if the correct answers are evenly distributed between yes and no).
Note that the condition that the correct answers are distributed %50:%50 between yes and no is itself a huge hint to the students if they know that in advance.
I suggest that you consider two alternative metrics:
Same as Phi
coefficient, Pearson correlation coefficient.
- Range: from -1 to 1
- All correct: 1
- All wrong: -1
- Random: 0
Measures the share of information (percentage of bits) contained in the true answers which is captured by the submitted answers (information here means entropy of the distribution).
- Range: from 0 to 1
- All correct: 1
- All wrong: 1 (sic!)
- Random: 0
Note that the scores of "all correct" and "all opposite" are the same. This is a feature, not a bug: the person who got all answers wrong has probably confused the labels ("yes" and "no") but knows the subject.
It also gives a lower score to "close to random" results than MCC.
IOW, it discriminates good results better.
Caveats
Missing Answers
If an answer is missing, it should be replace with a random yes/no answer.
This is correct statistically, but wrong pedagogically because the honest "I don't know" answer shows second order knowledge that should be encouraged.
Correct answer distribution
The metrics behave the same regardless of the distribution of the correct answers, except when all the correct answers are the same (in which case neither metric is defined). This is addressed by the Bernoulli shuffle (step 2 in the protocol).
These are statistical metrics
These metrics make little sense when there are very few questions.
Specifically, a mistake in one question may have a very different cost depending on the question (this can be addressed by repeating the Bernoulli shuffle many times and taking the average score - see protocol step 2 below).
Additivity
These metrics are not additive: you cannot score two halves of the test separately and somehow combine them to get the total test score (let alone add the scores for the two halves).
This can make these metrics a very hard sell to both students and administrators.
Protocol
Given the above, the correct protocol for these metrics is:
- Prepare hundreds of questions (it is okay for all questions to have the same correct answer).
- Using a Bernoulli rng with p=1/2, for each question, map
yes/no to A/B (i.e., for about 50% questions, yes will be A and for 50% it will be B, and for half of questions the correct answer is A) - this is done completely behind the screen. Neither the students nor the professor need to be aware what the actual map is.
- Score the resulting binary predictors (now both the true base rate and the predicted base rates are the same - 50%).
The dependency on the Bernoulli rng does introduce some noise (order 1/N where N is the number of test questions). I.e., the standard deviation of mcc and proficiency on a test with 100 questions will be under 1%. Since the steps 2 & 3 are automatic, they can be repeated many times and the mean or median score used.


